
Budgeting has a reputation for being tedious — line-itemed spreadsheets, dozens of categories, apps that ask you to tag every coffee. Most of that complexity doesn't make people better with money; it just makes them quit within a month. The 50/30/20 rule works because it does the opposite: it reduces your entire financial life to three numbers, which is exactly why it pairs so well with a simple money tracker instead of a full accounting system.
What the 50/30/20 rule actually says
Popularized by Senator Elizabeth Warren in her book All Your Worth, the rule splits your after-tax income into three buckets:
- 50% — Needs. Rent or mortgage, groceries, utilities, insurance, minimum debt payments — anything you'd struggle to live without.
- 30% — Wants. Dining out, subscriptions, hobbies, travel, upgrades — the spending that makes life enjoyable but isn't essential.
- 20% — Savings & debt payoff. Emergency fund, investments, retirement, and paying down debt faster than the minimum.
That's the whole system. No 15-category spreadsheet, no guessing whether a haircut is "personal care" or "miscellaneous" — just three buckets that map to how people naturally think about a purchase: did I need this, did I want this, or am I building toward something.
Why three categories beat fifteen
The failure mode of most budgets isn't overspending — it's abandonment. A budget with too many categories takes too long to update, so people stop updating it, and an unmaintained budget is worse than no budget because it creates false confidence. Three categories can be updated in seconds, which is the actual reason this method has stuck around for over a decade.
It also forces a useful discipline: before 50/30/20 tells you anything about individual purchases, it tells you whether your income can even support the life you're living. If your needs alone are eating past 50%, that's a signal no amount of expense-categorizing would have surfaced as clearly.
How to actually apply it this month
- Add up your take-home income for the month.
- Calculate your three targets: multiply by 0.5, 0.3, and 0.2.
- As you spend, sort each transaction into Needs, Wants, or Savings — nothing more granular than that.
- At the end of the month, compare your actual totals to the targets, not to perfection. Being a few percent off isn't failure; it's information for next month.
The percentages are a starting point, not a law — someone with high rent in an expensive city might run closer to 60/25/15, and that's fine. What matters is having three numbers you check consistently, instead of a system so detailed you abandon it by week two. A lightweight money tracker that mirrors these three buckets makes that consistency far easier than a spreadsheet you have to rebuild every month.
Where MoniTabs fits
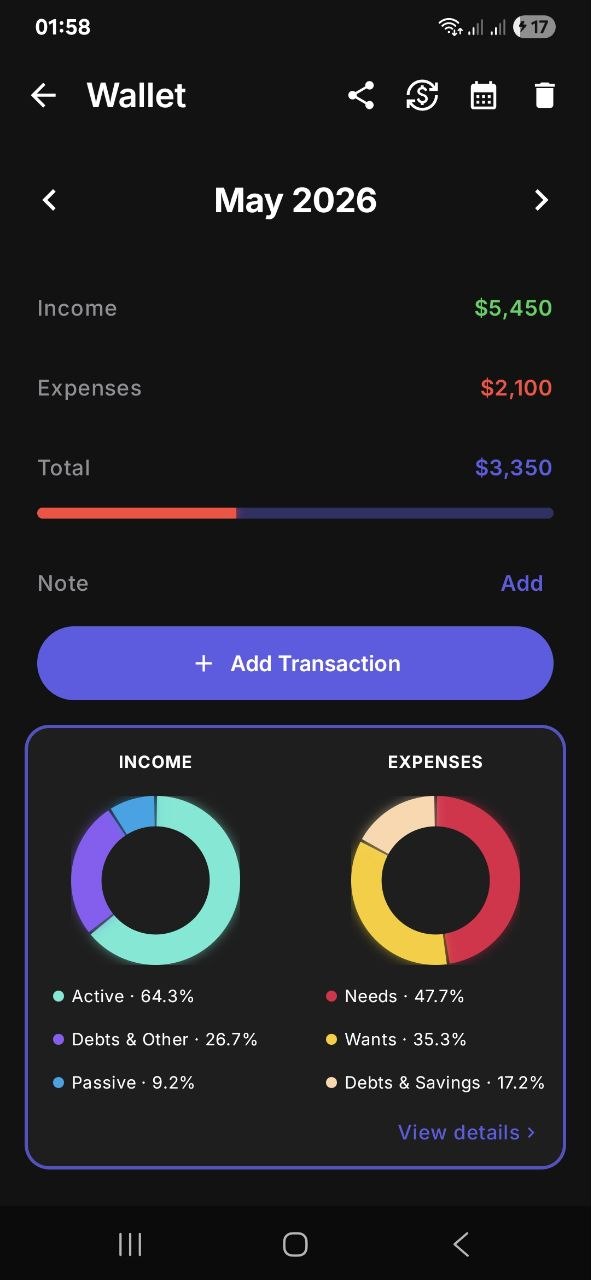
MoniTabs' Wallet tab is built directly around this structure — spending is split into three built-in categories, Needs, Wants, and Debts & Savings, matching the 50/30/20 shape exactly, so you're not stuck mapping your life onto boxes that don't fit. Inside each of the three categories, you can add your own custom labels — "Rent" and "Groceries" under Needs, "Tutoring" or "Etsy shop" income under its own category — so you still get the detail you want without losing the three-bucket simplicity that makes the method work in the first place. All tracked locally on your device, with a monthly view and pie charts so you can see at a glance whether this month landed where you meant it to.
Frequently asked questions
What is the 50/30/20 rule?
The 50/30/20 rule splits your after-tax income into three buckets: 50% for needs, 30% for wants, and 20% for savings and debt payoff.
Does the 50/30/20 rule work on a low income?
It works as a starting ratio rather than a fixed rule. If needs take up more than 50% of your income, treat that as a signal to adjust the split rather than force the exact percentages.
How do I track 50/30/20 without a spreadsheet?
Use a money tracker with three built-in categories matching Needs, Wants, and Savings, so each transaction takes seconds to log instead of requiring a detailed spreadsheet.